チャート - グラフ
グラフの凡例を設定したい
グラフの凡例はChartクラスのlegendプロパティで設定します。
legendプロパティではChartLegendオブジェクトのアクセッサが取得でき、表示位置や背景色などを設定することが可能です。
凡例に表示したいタイトルは、createSeriesメソッドで生成したグラフオブジェクトのtitleプロパティに設定します。
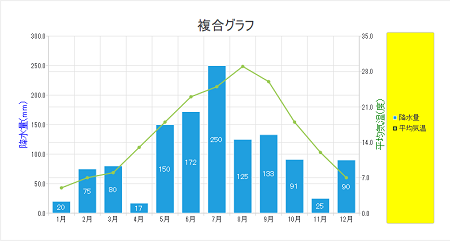
サンプルの場合、棒グラフの凡例として「降水量」、折れ線グラフの凡例として「平均気温」が表示されています。
【実行結果】
Form Form1 { x = 0; y = 0; width = 849; height = 481; /* 折れ線グラフ用CSVデータ */ CsvDocument csvData; csvData << CSV() { 0,5 1,7 2,8 3,13 4,18 5,23 6,25 7,29 8,26 9,18 10,12 11,7}; Chart chart1(chart.CHARTTYPE_MULTI) { x = 29; y = 29; width = 788; height = 420; title = "複合グラフ"; font = new Font("MSゴシック",18); /* 凡例の設定 */ legend.bgVisible = TRUE; legend.bgColor = new Brush("YELLOW", Brush.SOLID); legend.borderColor = Color.LGRAY; legend.alignment = LEGENDALIGN_RIGHT; /* 背景色の設定 */ bgColor = Color.WHITE; /* 方向軸の取得 */ var leftAxis = getAxis(AXISALIGN_LEFT); var rightAxis = getAxis(AXISALIGN_RIGHT); var bottomAxis = getAxis(AXISALIGN_BOTTOM); /* 棒グラフ */ var cs1; cs1 = createSeries(AXIS.SERIESTYPE_BAR, bottom leftAxis); cs1.labelsVisible = TRUE; cs1.barWidth = 0.7; /* 棒グラフのデータを設定 */ var cbi1 = new ChartBarItem(); cbi1.title = "降水量"; cbi1.font = new Font("MSゴシック",10); cbi1.color = Color.WHITE; cbi1.add(20); cbi1.add(75); cbi1.add(80); cbi1.add(17); cbi1.add(150); cbi1.add(172); cbi1.add(250); cbi1.add(125); cbi1.add(133); cbi1.add(91); cbi1.add(25); cbi1.add(90); cs1.addItem(cbi1); /* 折れ線グラフ */ var cs2 = createSeries(AXIS.SERIESTYPE_LINE, bottom rightAxis); cs2.markerVisible = TRUE; cs2.title = "平均気温"; /* CSVデータをロード */ cs2.load(^.csvData); /* 左軸の設定 */ leftAxis.tickCount = 7; leftAxis.min = 0; leftAxis.max = 300; leftAxis.title = "降水量(mm)"; leftAxis.titleColor = Color.BLUE; leftAxis.titleFont = new Font("MSゴシック",12); leftAxis.titleVisible = TRUE; /* 右軸の設定 */ rightAxis.tickCount = 6; rightAxis.min = 0; rightAxis.max = 35; rightAxis.title = "平均気温(度)"; rightAxis.titleColor = Color.DGREEN; rightAxis.titleFont = new Font("MSゴシック",12); rightAxis.titleVisible = TRUE; /* 下軸の設定 */ var arr = new Array(); arr[0] = "1月"; arr[1] = "2月"; arr[2] = "3月"; arr[3] = "4月"; arr[4] = "5月"; arr[5] = "6月"; arr[6] = "7月"; arr[7] = "8月"; arr[8] = "9月"; arr[9] = "10月"; arr[10] = "11月"; arr[11] = "12月"; bottomAxis.strings = arr; } }
Biz-Collections Bizの宝箱 トップへ
Biz/Browser DT・Biz/Designer DT TIPS集 トップへ

 Biz-Collections Bizの宝箱 トップへ
Biz/Browser DT・Biz/Designer DT TIPS集 トップへ
Biz-Collections Bizの宝箱 トップへ
Biz/Browser DT・Biz/Designer DT TIPS集 トップへ